
News ·
NSW Low Mid Rise Reform is Now Finalised
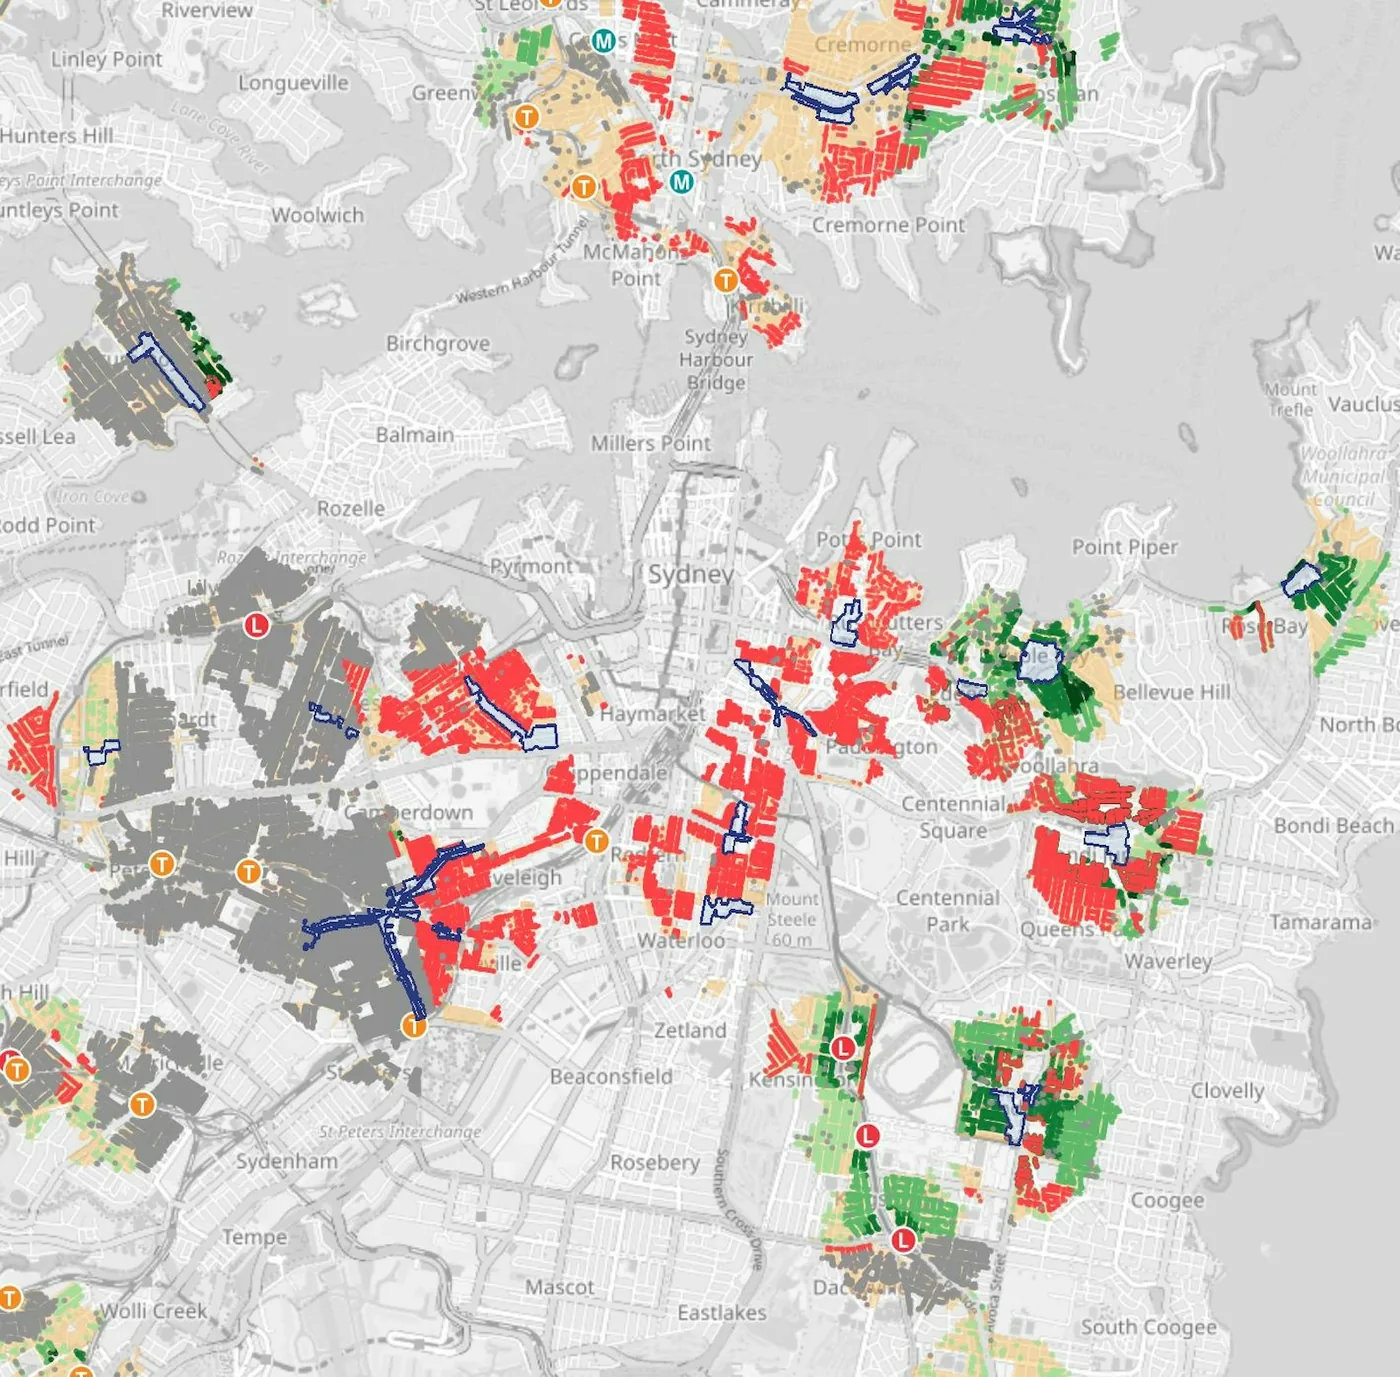
After over 14 months of waiting, the massive planning reform targeting stations and centres across New South Wales has been finalised at last and will come into force on 28 February 2025. It’s not an understatement to call this one of the biggest wholesale planning changes in the history of New South Wales.
(The following information supersedes any details in our prior blog posts.)
PropCode can help you understand the planning rules that apply to your specific property:
What’s the latest update?
Today (21 Feb 2025) the NSW Department of Planning announced the finalised Low and Mid Rise (LMR) reform details. They are largely the same as was leaked in a Policy Refinement Paper in May 2024 and represent a scaling down of the ambition of the original proposal in an Explanation of Intended Effect in Dec 2023.
The final rules will be gazetted to take effect on 28 Feb 2025, including maps of the defined areas in which the rules apply. The rules will apply to any development applications (DAs) made from that day forward.
What are the final implemented rules?
The LMR reform targets a selected set of stations and centre zones, 171 in total across Sydney-Newcastle-Shoalhaven. The new rules apply to residential zones within 800m walking distance of the station entrance or centre zone. Rather than force users to calculate this distance, the rules will include a map of the precise properties to which the reform applies. The government released indicative mapping which will be replaced by final gazetted mapping soon.
Within a mapped LMR area, in a residential zone, and subject to exclusions listed below, the following are the new rules that override any contrary LEP or DCP rules. They are non-discretionary standards, which simply means a DA cannot be rejected for that reason if it meets the numerical standard.
Permissibility
This new permissibility is in addition to the permissible uses already listed in the LEP zone. For example many LEPs permit dual occupancy in zones other than R2.
| Building type | Zones |
| Dual occupancy | R2 (statewide; gazetted on 1 July 2024) |
| Multi dwelling housing | R1, R2, R3 |
| Terraces | R1, R2, R3 |
| Residential flat building | R1, R2, R3, R4 |
| Shop top housing | No change |
Minimum lot size
| Building type | Area | Width |
|---|---|---|
| Dual occupancy | 450 sqm | 12 m |
| Multi dwelling housing | 600 sqm | 15 m |
| Terraces | 500 sqm | 18 m |
| Residential flat building & shop top housing | In R1/R2 zone: 500 sqm | In R1/R2 zone: 12 m |
| In R3/R4 zone: no minimum (cancels any LEP rule) |
Subdivision minimum lot size
Subdivision will be permissible only in R1, R2, and R3 zones.
| Building type | Area | Width |
|---|---|---|
| Dual occupancy | 225 sqm | 6 m |
| Terraces | 165 sqm | 6 m |
Maximum FSR
| Building type | 0-400m | 400-800m |
|---|---|---|
| Dual occupancy | 0.65 : 1 | |
| Multi dwelling housing & terraces | 0.7 : 1 | |
| Residential flat building & shop top housing | In R1/R2 zone: 0.8 : 1 | |
| In R3/R4 zone: 2.2 : 1 | In R3/R4 zone: 1.5 : 1 |
Maximum height
| Building type | 0-400m | 400-800m |
|---|---|---|
| Dual occupancy, multi dwelling housing, & terraces | 9.5 m | |
| Residential flat building & shop top housing | In R1/R2 zone: 9.5 m | |
| In R3/R4 zone: 22 m | ||
| (24m for shop top housing) | In R3/R4 zone: 17.5 m |
What about approval by CDC?
Some of the rules will also expand eligibility for complying development (CDC) approval of medium density projects under the Low Rise Housing Diversity Code, where the CDC pathway would otherwise have been available but for lack of permissibility. New minimum lot size rules may also change CDC eligibility, depending on how the gazetted rules are actually written.
Importantly, there is no change to the previously gazetted dual occupancy permissibility in R2 zone, and this is still unavailable for CDC until 1 July 2025 where it was previously prohibited. There is no indication that the new LMR permissibility taking force on 28 Feb 2025 is subject to the same CDC delay.
How much impact does this have?
Applying the indicative LMR maps released today against PropCode’s database, over 226,000 properties are in a mapped LMR area in a residential zone. However, the standard exclusions from the LMR reform (such as ANEF, bushfire, etc.) remove 41,000 properties, leaving 185,000 to potentially benefit.
Of these, 129,000 have at least one building type with FSR uplift (satisfying the LMR minimum lot size), while 56,000 are too small or don’t gain any new permissibility or higher FSR.
The properties that do benefit are spread across many LGAs, with 35 LGAs having at least 1,000 properties each - even Hunters Hill! The biggest area of change is Sutherland LGA with nearly 10,000 properties getting FSR uplift. The table below shows the impact by LGA.
To get bulk extracts of the per-property impacts, please contact us here; for example the entire LMR dataset can be purchased for $1,648.90 inc GST.
| LGA | Total in LMR Area | LMR Exclusion | No Benefit | FSR Uplift |
|---|---|---|---|---|
| Bayside | 7,884 | 3,320 | 1,877 | 2,687 |
| Blacktown | 4,712 | 21 | 801 | 3,890 |
| Burwood | 3,613 | 228 | 1,538 | 1,847 |
| Camden | 1,528 | 145 | 93 | 1,290 |
| Campbelltown | 3,612 | 131 | 602 | 2,879 |
| Canada Bay | 9,182 | 2,639 | 2,023 | 4,520 |
| Canterbury-Bankstown | 4,109 | 291 | 378 | 3,440 |
| Central Coast | 5,038 | 1,387 | 603 | 3,048 |
| Cessnock | 1,763 | 59 | 10 | 1,694 |
| Cumberland | 7,809 | 892 | 2,432 | 4,485 |
| Fairfield | 4,623 | 94 | 980 | 3,549 |
| Georges River | 9,428 | 288 | 2,807 | 6,333 |
| Hornsby | 3,949 | 836 | 274 | 2,839 |
| Hunters Hill | 1,298 | 102 | 144 | 1,052 |
| Inner West | 24,672 | 19,712 | 3,567 | 1,393 |
| Kiama | 778 | 36 | 158 | 584 |
| Ku-ring-gai | 6,763 | 1,604 | 304 | 4,855 |
| Lake Macquarie | 5,283 | 1,917 | 203 | 3,163 |
| Lane Cove | 2,173 | 177 | 268 | 1,728 |
| Liverpool | 154 | 2 | 130 | 22 |
| Maitland | 3,166 | 143 | 393 | 2,630 |
| Mosman | 2,751 | 108 | 683 | 1,960 |
| Newcastle | 13,295 | 1,944 | 3,569 | 7,782 |
| North Sydney | 5,456 | 382 | 2,081 | 2,993 |
| Northern Beaches | 11,281 | 1,015 | 3,136 | 7,130 |
| Parramatta | 5,808 | 141 | 674 | 4,993 |
| Penrith | 1,184 | 22 | 338 | 824 |
| Port Stephens | 1,863 | 65 | 457 | 1,341 |
| Randwick | 8,770 | 792 | 3,455 | 4,523 |
| Ryde | 8,914 | 200 | 1,330 | 7,384 |
| Shellharbour | 3,616 | 182 | 188 | 3,246 |
| Shoalhaven | 1,493 | 128 | 126 | 1,239 |
| Strathfield | 978 | 192 | 56 | 730 |
| Sutherland | 11,795 | 148 | 1,748 | 9,899 |
| Sydney | 15,138 | 1,292 | 13,789 | 57 |
| The Hills | 4,640 | 66 | 386 | 4,188 |
| Waverley | 2,734 | 67 | 1,060 | 1,607 |
| Willoughby | 5,148 | 107 | 1,313 | 3,728 |
| Wollongong | 4,852 | 339 | 441 | 4,072 |
| Woollahra | 5,403 | 186 | 1,958 | 3,259 |
| GRAND TOTAL | 226,658 | 41,401 | 56,373 | 128,884 |